Launching FruZzZ - the sleep tracker
When data needs lead to solutions
In some households, when one caregiver claims to put the munchkin to sleep earlier than you and questions your lulling methodologies, the other responds with, “let’s look at the data.” The only quirk is, there are no data. Until now, that is. With the launch of FruZzZ, this question can finally be plainly laid to rest - following a few months of observation.
What is it? Simplicity as a paradigm
The app is designed to quickly and quietly record the caregiver who put the munchkin to sleep on a particular night. It then records the nightly data and displays the summary stats in a dashboard. In fact, making a new entry for the night requires only 2 clicks, 3 if you’re not yet logged in. A few more if you have yet to register.
The Flow
Below is the outline of the flow from registration to daily usage.
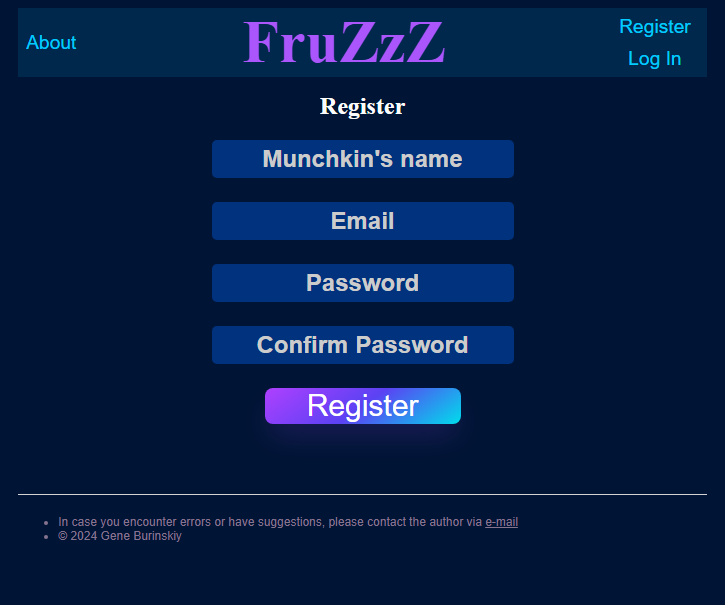
Register the munchkin
When reigstering, you’ll be asked to supply a name for the munchkin, we obviously prefer unique nicknames, and an e-mail.
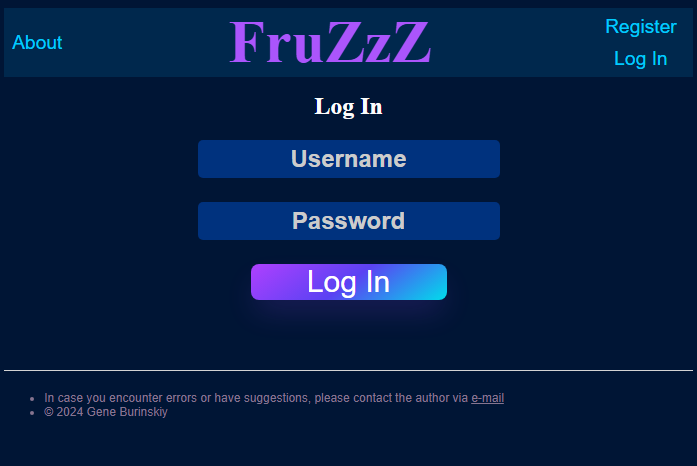
Log In
Once registered, you can login. The app will automically detect that there are no registered parents yet and lead you to the parental registration page.
Register the parentals
Here, we add the names of the caregivers who put the registered munchkin to bed. Dad, mom, multiple dads, multiple moms, or nannies or uncles, it really doesn’t matter. Just limit yourself to 5 entries.
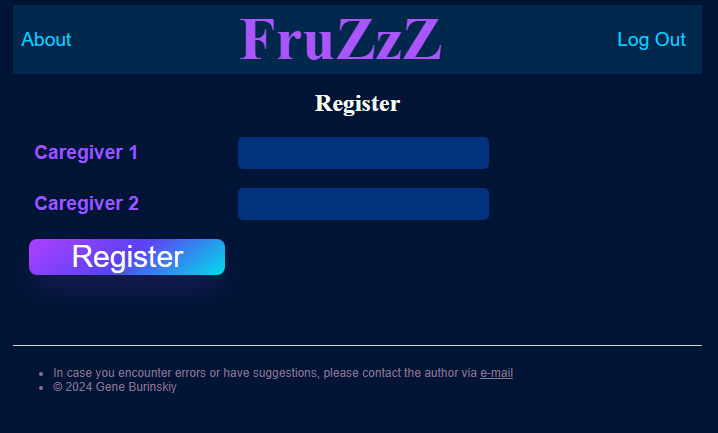
Once this step is completed, recording is the only thing left to do.
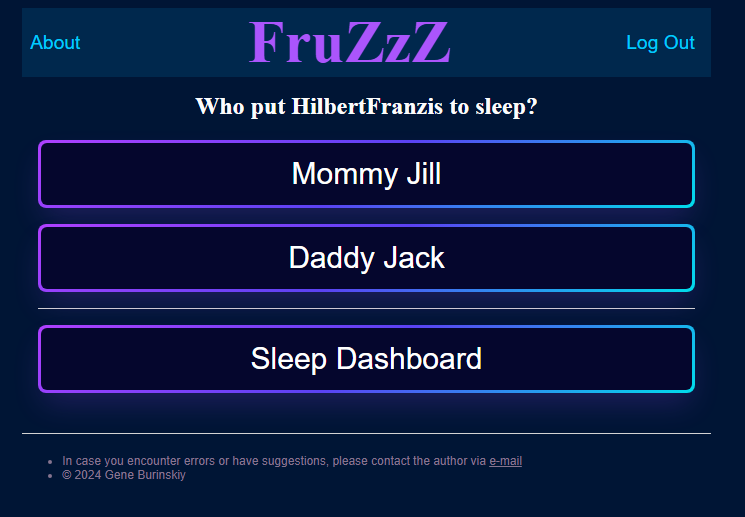
Record Away
Select the caregiver who put the munchkin to bed then confirm the date and time on the subsequent page.
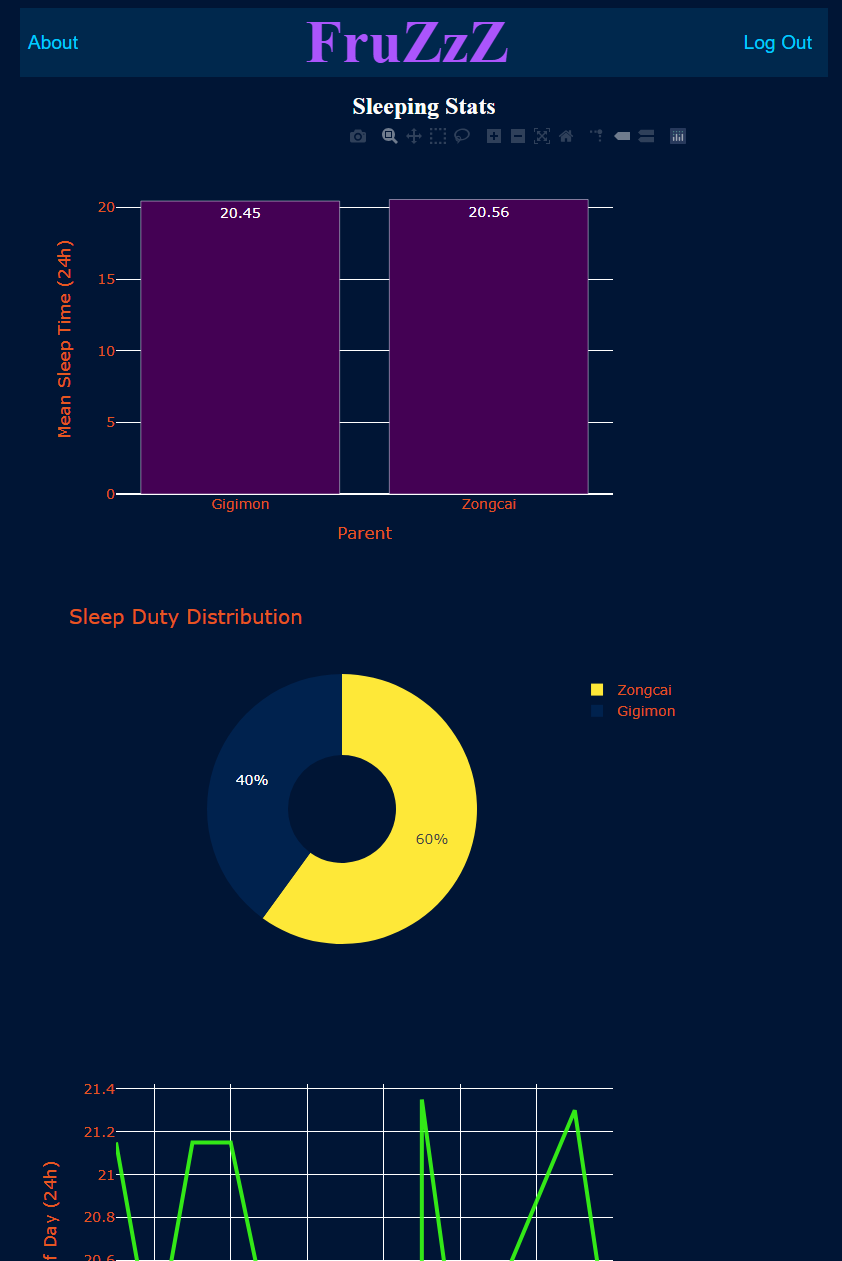
Dashboard
The dashboard shows 3 graphs:
1) the average time each caregiver puts the munchkin to sleep,
2) the share of lulling that each caregiver is responsible for
3) a graph of sleep times across the days
The Build
Dash, Plotly - both almost standard tools in a data scientist’s toolbox but can they do more than a single page dashboard? The answer is, as I found out, no. As a result, I built this app using Flask, the parent of Dash, and tagged Plotly directly as the visualization engine of the app.
Both the database and app are hosted on Clever-Cloud, a French startup that seems to be a competitor to the likes of Heroku, albeit, perhaps not as streamlined yet. I mostly chose CC because it allowed me to host a small PostgreSQL database for free. The app is served using gunicorn.
The app is on GitHub with the to-do list tagged along in the about section. For now, the app is mostly in beta testing. It works as is but there are some features that I must add before it goes out to the greater public so it can accomodate more parental configurations.