Market Power in the Milwaukee housing market
Intro
In Evicted, Desmond mentions that some landlords have rather large rental unit holdings which made me wonder: how competitive are rental markets? We often assume competitive markets (i.e. lots of buyers and sellers) and this assumption probably holds at the MSA level and for households who have access to tools(ie Zillow, Hotpads) that expose them to the entire market. What about households who either don’t have access or don’t use such tools and instead find housing through social networks or other means that geographically constrain or obsurce their options? If a few landlords own a large portion of the area in which such households shop then these households may be shopping in an oligopolistic market.
To start exploring this question, I lean on the Milwaukee Master Property Record that the City of Milwaukee makes publicly available. Specifically, city-wide property data were sourced from here and the data are documented here. MPROP contains detailed ownership, number of units, value, zoning, land use, and many other fields for each known property in the City of Milwaukee. Moreover, each property is geocoded to the Census block so I can merge the MPROP files with Census Tiger files. Although the data are rich in countless aspects, I focus on computing market concentration indexes for residential units. To find residental units, I restrict my data to properties whose zones and/or land use fields are marked as residential. I will also not discuss data limitations in this post because there are many but if you’re curious here’s one of my pertinent stack questions.
Method
One way to measure market concentration is the Herfindalh-Hirschmann Index. I compute HHIs at the city, Census tract, block group, and block levels. An HHI index of 0 suggests a perfectly competitive market while an index of 1 suggests and perfectly monopolistic market. Usually, HHIs over .2 are considered cause for concern. To get market share, I find the number of units owned in each area by each owner and divide by the total number of units in area that area.
Note that I do not yet have a reliable way of discerning which units are owned and which are rented which means that if we are examining the rental market, then the HHIs I compute are bias toward 0 except in areas where there are only rental units. As a result, it is possible that the HHIs faced by renters are somewhat higher than the estimates I provide.
The HHIs that I compute do not apply to the entire rental market equally. Households who use tools that expose them to large swathes of the rental market are likely to operate in a city-wide market. A city-wide HHI is probably more applicable to them. On the other hand, if a household searches with a method that geographically restricts its search then HHIs computed over smaller spaces are likely more applicable.
Results
After some extensive cleaning, the HHI for the City of Milwaukee turns out to be 0.005 or virtually zero and hence competitive. However, this assumes that the market is the entire city. If we restrict markets to Census tracts then of 213 with over 10 residential units, 3 have HHIs over .2. Repeating the exercise for Block Groups, of 574 block groups with at more than 10 units and 1 property, 20 have concentrations over .2. At the Census Block level, of 5461 blocks, a whopping 580 have HHIs over .2 with 30 blocks having concentrations near 1.
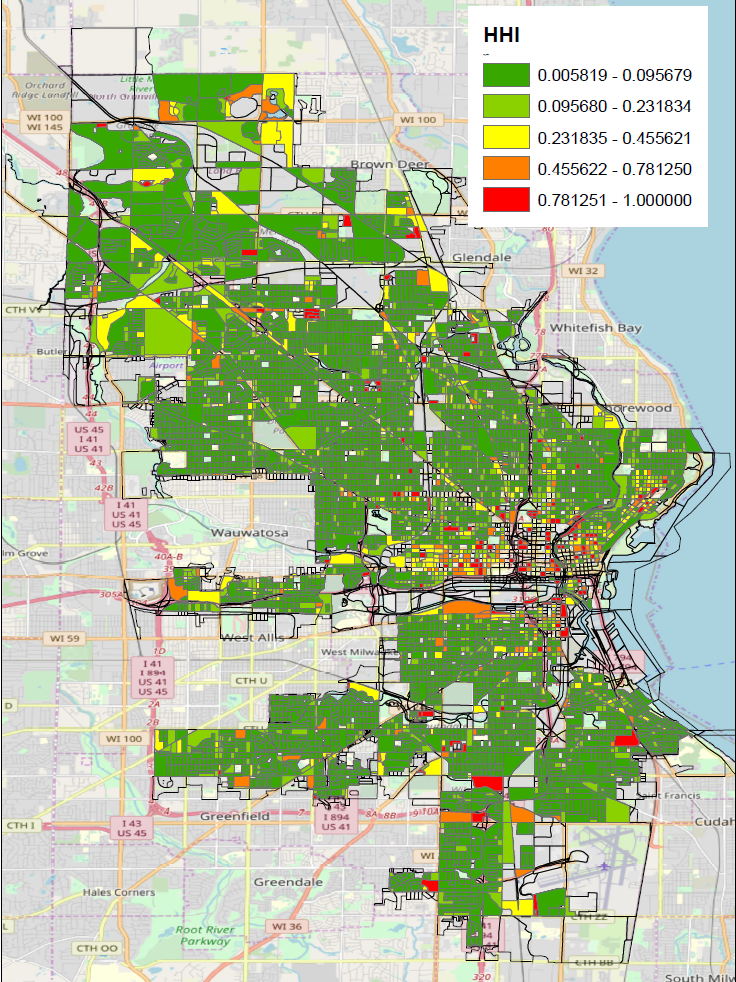
I leverage the Census Tiger files to map the HHI indexes at the Census block level for blocks with more than 2 units, 2 properties, and 10 residents. As we can see, most of Milwaukee is green suggesting that block-level HHIs fall into the .005-.01 levels(these tracts are likely to be predominantly owner-occupied units). However, toward the center and downtown parts of Milwaukee, we see a much higher concentration of blocks with HHIs over .2.
| fitcoef | R^2 adj | nObs | |
|---|---|---|---|
| log median home value | 0.0090 (0.151) | 0.002 | 532 |
| proportion cheap | 0.1700 (0.000) | 0.101 | 571 |
| proportion black | 0.0050 (0.585) | -0.001 | 571 |
| proportion rent | 0.1430 (0.000) | 0.161 | 571 |
| proportion vacant | -0.0150 (0.667) | -0.001 | 571 |
| median gross rent | -0.0000 (0.000) | 0.022 | 554 |
| proportion over age 65 | 0.0230 (0.634) | -0.001 | 571 |
| units per person | 0.0090 (0.015) | 0.009 | 571 |
To examine demographic patterns, I merge my block group level HHIs with ACS block group level data for Milwaukee County and regress the ACS data on HHIs1. I find that block groups with higher shares of units costing $10,000-$15,000, higher concentrations of renters, and more people per housing unit also tend to have higher market concentration. These figures suggest, though indirectly, that low-income areas with high renter shares are more likely to coincide with areas that have higher market concentrations. This could lead to low-income households being charged higher rents but I cannot test that directly yet without further data.
Discussion
Of course, the more we segment and constrain market definitions (ie in space or otherwise), the higher HHIs will be. Additionally, the Census does not choose its tracts, block groups, and blocks to align with local perceptions of what defines housing markets (a task particularly difficult since households at different socio-economic levels may have different market spans). This means that from the housing market perspective, these geographical cuts are likely arbitrary but the effect thereof is unclear. Arbitrary segmentation may add noise to our HHI measures and thus dilute the indexes. On the other hand, the Census chooses blocks and block groups so that demographic compositions within would be homogenous which may coincide with actual market boundaries.
1: Variable definitions proportion cheap: share of homes costing $10,000-15,000 in a block group; proportion black: share of population that’s black in block group, proportion rent: share of households that rent; proportion vacant: share of units that are vacant in a block group; proportion over 65: share of households with head of house over age 65; units per person: number of housing units per person in a blcok group.