Housing search across incomes
Introduction
Recently, I reviewed a paper that boldly claimed that internet access and use gap between low-income and high-income households has practically closed and that low-income households use online tools to find housing at the same rate as higher-income households. They did not provide any direct evidence of this beside an allusion to some American Community Survey (ACS) data. Although I cannot assess the first claim, the second claim can be roughly examined using the 2015 and 2017 American Housing Survey (AHS) data. In brief, data from the AHS suggest that a household’s socio-economic status still negatively correlates with the use of online resources to find housing.
For households who moved within 2 years of the survey, the AHS collects data on how households found the unit they currently inhabit and provide 7 different search technologies including 1) family, friends, etc 2) rent sign, 3) newspaper 4), real-estate agent, 5) internet, 6) apartment rental agency listing ,and 7) other. I examine whether fewer low-income households employ the internet to find housing using two simple ways. First, I tabulate the share of households in each income quintile that use a particular search technology. Second, I run a logit model on whether a household used the internet to find housing against a number of household characteristics including income.
Results
Search technology by income
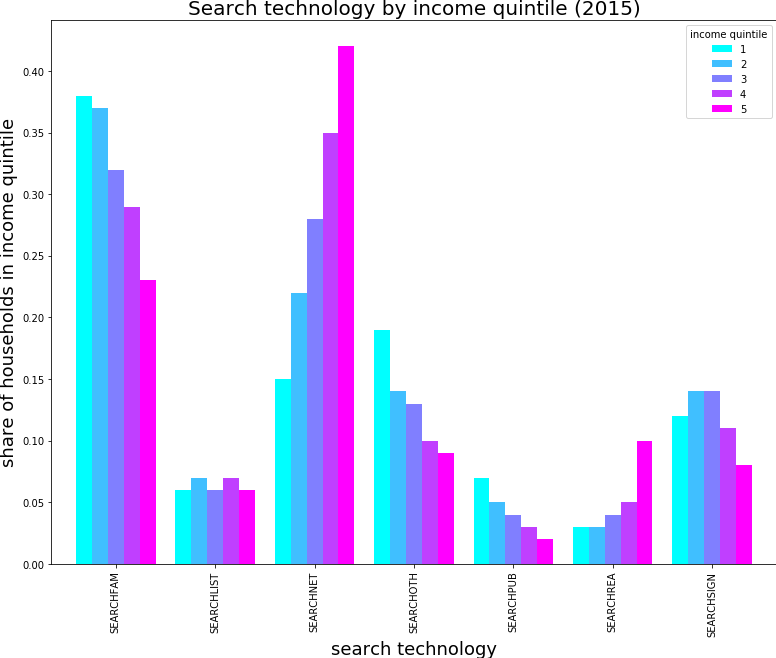
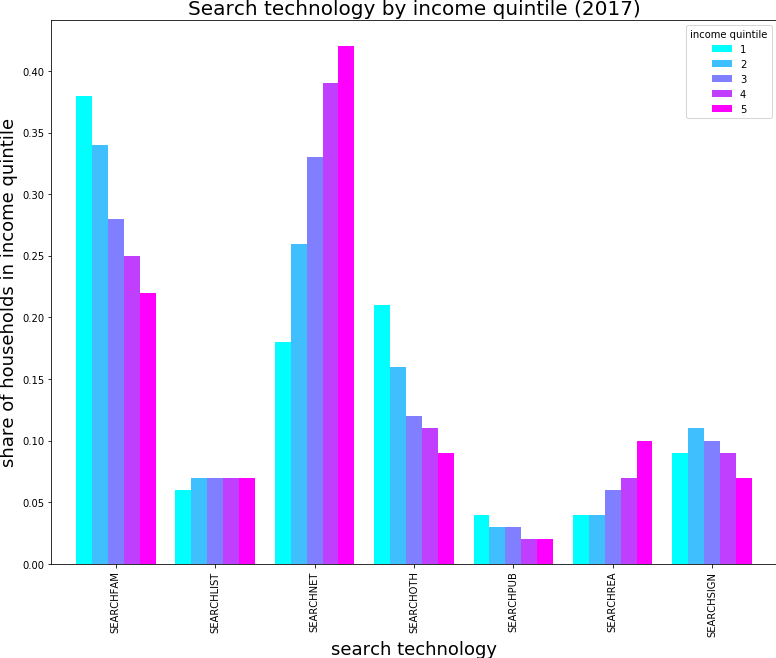
I divided renter households by income quintiles, with quintile 1 being the lowest, and tabulated the share of households in each income bin that use each of the search technologies. The results can be observed in the two figures below. As a check to understanding, the bright pink bars should add up to 1 across the technologies. There are many interesting patterns we can observe in the plots but let’s focus on the question at hand.
While 42% of households in the top quintile used the internet to find their most recent dwelling, only 15% of households in the lowest quintile did in 2015. The picture looks largely the same in 2017. In fact, no other search technology shows a greater employment disparity than the internet. This alone is a large red flag on any claims that households across the income distribution use online resources to find housing. Conversely, we see that low-income households tend to employ social networks much more often than high-income households. In 2015, 37-38% of households in the lowest 2 quintiles used social networks to find housing but only 23% of households in the highest quintile did the same. This disparity persists in 2017.
Logistic regression
I also run a logistic regression on whether the household used the internet to find housing or not. The control variables include things such as the household’s log-income(logincome), whether it’s a female-headed household(femaleHH), whether the household’s head has a college or higher education (collegeOrMore), whether it’s married (marriedHH), whether it’s a black or Asian household, the number of adults in the household (NUMADULTS), and a dummy for each of the MSAs.
Every coefficient behaves in the expected manner. The positive coefficients on the log-income and college variables imply that higher-income and better educated households are more likely to employ online resources to find housing. Conversely, the negative coefficients on household age and number of adults suggest that older households and those with more adults are less likely to use online resources to find housing. To ease interpretation, holding all other variables at the average, a decrease in income from $42,000 (the average) to $15,371 implies a 10% decrease in the chance that the household will use online resources. Of course, this is not a fair comparison since, for example, lower-income households are also more likely to have a lower education so the actual predicted chance of using online resources is probably larger.
Discussion
Although the above analysis is by no means rigorous, the stark differences in use of the internet to find housing across the income spectrum suggests that it is highly unlikely that low and high income households use the Internet to find housing at similar rates. The similarity between 2015 and 2017 also suggests that the gap is slow to close.
There are many things we should watch out for in the above analysis. For example, it is possible that finding housing online actually leads to higher incomes or a better education so we need to watch out for reverse causality. A bigger social concern would be the following. Suppose all income groups do start with the internet to find housing but the units advertised online are either too expensive or are in the wrong place for low-income households. This would lead low-income households to seek other sources of information for housing yet yield numerical patterns similar to those observed above.
Indeed, from a policy perspective, the question of why do low-income households not use the internet is a crucial concern. If lack of internet use is due to inadequate access or lack of habit then a policy engaging the community and familiarizing them with these resources is a potential channel of resolution. On the other hand, if low-income households do not use the internet to find housing because the advertised units do not fit their budget or preferences then a proper policy intervetion would perhaps have to tackle issues on the supply side.