New construction and housing affordability
Introduction
Not too long ago, I stayed up passed midnight on a planning commission hearing for a project in Alhambra where an innumerable number of people called-in or wrote that construction of a new project will reduce the stock of affordable housing. Is this fear founded on any empirical evidence?
In brief, it’s complicated. A quick look at building permits and rental data robustly indicates that construction of new units adds to the stock of housing renting for $1500+ per month. This is is not surprising given that’s what developers tend to build in LA. There is further some evidence that construction of new units is related to a limited loss of affordable units but the estimates are not robust and a causal relationship is not determined.
Approach
I use American Community Survey(ACS) Block Group-level data on the number of units at various rent tiers and regress it against the number of units that were added according to LA City’s building permit data.
Since ACS data come in 5-year periods, I compare unit changes between ACS surveys ending in 2012 and 2017 to the total number of units added between 2013 and 2017 according to the building permit data. I perform a similar exercise by comparing unit changes between the 2017 and 2018 ACS surveys to the number of units added in 2018. Note, I only use Block Groups that had at least 1 renter and new building.
Before I describe the results, I should mention that I transformed some of the building permit data variables to reel in some of the left tails in the permits data. I could log-transform number of units lost to building demolitions and number of units in new buildings because values don’t change signs. Building additions and alterations take on both positive and negative values making it more difficult to normalize those values without recourse to standardization. I mention this because transformations heavily impact estimates. I include the untransformed results at the bottom.
Results
The results in the table below suggest that construction of new units is significantly and positively related to the loss of units renting between $600-$1,000 per month. For a sense of magnitude, the estimates imply that 3 newly built units would lead to a loss of 3 units in the $600-$799 range and a loss of 2 units in the $800-$1,000 range. 100 new units would lead to a loss of about 14 and 10 units, respectively.
Results also suggest that the construction of new units leads to more units renting for $1,500+. Of course, this result is not surprising given that developers in LA City tend to build units catering to middle and high-income households. Though, I would also not like to discount the fact that new affordable housing is built and the non-trivial impact of measure JJJ.
Two other things pop out. Regardless of variable transformations, construction of new units, demolition, and other activities, explain up to about 2% of variation in $600-$1,000 unit changes but up to 40% of the $2,0000+ unit changes. This suggests that even if construction of new units does cause a decrease in more affordable units, there are likely many other factors at play.
| Rent600to799 | Rent800to999 | Rent1000to1249 | Rent1500to1999 | Rent2000orMore | |
|---|---|---|---|---|---|
| Bldg_Addition | -0.168* | 0.276** | -0.157 | -0.322* | 3.634*** |
| Bldg_Alter_Repair | 0.101 | -0.132 | 0.067 | 0.343*** | -0.258** |
| np.log1p(np.abs(Bldg_Demolition)) | 1.207 | -0.739 | -4.974*** | 0.602 | -3.983** |
| np.log1p(Bldg_New) | -3.029*** | -2.154** | 0.109 | 2.787** | 16.021*** |
| r_squared | 0.02 | 0.01 | 0.01 | 0.01 | 0.29 |
| adjusted_r | 0.02 | 0.01 | 0.01 | 0.01 | 0.29 |
| f-stat | 6.92 | 3.71 | 4.22 | 4.76 | 156.25 |
| n_obs | 1550 | 1550 | 1550 | 1550 | 1550 |
Estimates for the 2017-2018 periods show similar results but with smaller coefficient magnitudes. I included these results at the bottom.
Conclusion
So what does this mean for those who call the planning commissioners and city councils to say that new development will make rents in neighborhoods less affordable? If we brush aside the rather large volume of model and data issues I enumerate below, one could say that these callers have some suggestive empirical backing but a more thorough study would be needed to convincingly examine the causal links between the two phenomena.
The Data
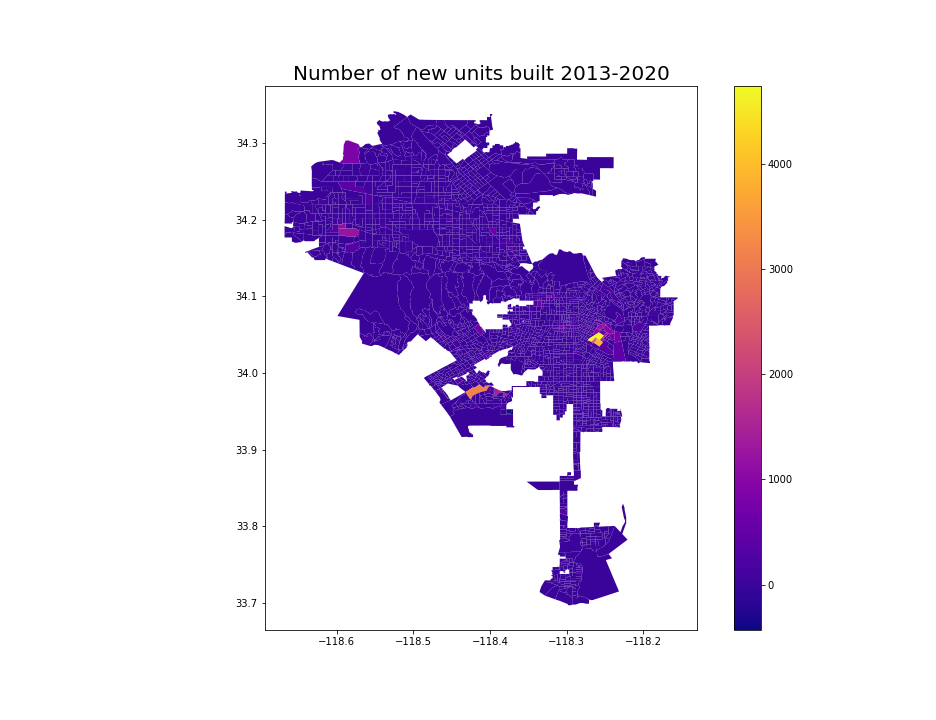
I obtain data on all building permits issued in LA City between 2013 and 2020 from LA City’s Open Data portal. I use the location, type, date, valuation, and number of units per permit for residential projects that were issued a building permit.
Data on rent distributions at the Census Block Group level were obtained from the 5-year American Community Survey(ACS)s for year spans starting with 2008-2012, 2013-2017, and ending with 2014-2018. Rent data were spatially matched to building permit data using Census TIGER shapefiles. Since I am comparing 5-year periods, substracting the 2008-2012 housing stock from 2013-2017 gives me the amount of housing that was added between 2013-2017. However, note that subtracting 2013-2017 from 2014-2018 data effectively compares 2014 to 2018 unit counts provided uniform sample weighting by the Census.
Iffy data fidelity
There are a few most or less obvious concerns with the data. First, I am comparing nominal rents, not real rents because it is a tad difficult to deflate aggregated ACS data. However, given that inflation has been fairly low over the past decade, that shouldn’t be too much of a concern. On the other hand, we also have to acknowledge that rents grow over time so even in absence of new construction, the stock of units in the $600-1000 will decrease.
Second, it seems building permits don’t quite account for the full number of new units in a given area. LA City releases a Housing Annual Progress Report. In the 2019 Report, we see that LA City annually approved a minimum of 13,696 units and a maximum of 22,258 units between 2014 and 2019. The building permit data suggest a min of 10,572 and a max of 12,777 in the same period. Moreover, the time series pattern between the two datasets don’t match. The totals in the data do not match either. According to the Housing Progress Report, LA City produced 82,097 units while the permits data suggest 57,165. Is ACS data better? In the same period, ACS says that LA City produced 51,772 units.
Given that all data sources seem to underestimate the amount of development that’s happening in LA City, the estimated coefficients likely understate the true effects.
Other issues
ACS rent distributions are not disaggregated at the price and unit-size level. Since larger units tend to rent for higher prices, if a developer builds 3-bedroom apartments in a neighborhood of 1-bedroom apartments then even if the larger new units are priced comparably to existing units per square foot, we’ll still see an upward shift in the rent distribution.
Then there are endogeneity issues. Developers don’t just randomly pick neighborhood in which they build - they typically perform careful analysis to make sure that the neighborhoods they’ll build are desirable places to live in. As a result, it is completely possible that rents in a neighborhood don’t go up because of new construction but rather because of the already-existing amenities that both rents and developers are responding to.
Rent control is another issue. Even if local amenity-improvements would lead to higher land values, rent in rent-controlled units would be locked in; thereby, dampening the effect of new development. Since I don’t observe rent-controlled units, I would assume that the above estimates understate the impact on units that don’t have the luck of being rent-controlled.
2017-2018 results
| Rent600to799 | Rent800to999 | Rent1000to1249 | Rent1500to1999 | Rent2000orMore | |
|---|---|---|---|---|---|
| Bldg_Addition | -2.907** | -0.778 | 0.657 | 4.571 | -3.987 |
| Bldg_Alter_Repair | -0.571 | -1.075 | 1.114 | -1.314 | -0.232 |
| np.log1p(np.abs(Bldg_Demolition)) | 0.247 | 3.025*** | -0.647 | -1.58 | -0.564 |
| np.log1p(Bldg_New) | -0.949** | -2.358*** | -1.849* | -1.584 | 9.499*** |
| r_squared | 0.02 | 0.02 | 0.01 | 0.01 | 0.06 |
| f-stat | 2.81 | 3.9 | 1.59 | 1.58 | 11.04 |
| n_obs | 731 | 731 | 731 | 731 | 731 |
Untransformed variables
| Rent600to799 | Rent800to999 | Rent1000to1249 | Rent1500to1999 | Rent2000orMore | |
|---|---|---|---|---|---|
| Bldg_Addition | -0.267*** | 0.238* | -0.183 | 0.092 | 2.766*** |
| Bldg_Alter_Repair | 0.053 | -0.157* | 0.068 | 0.465*** | -0.354*** |
| Bldg_Demolition | -0.004 | 0.092 | 0.38*** | -0.219 | -0.515*** |
| Bldg_New | 0.004 | -0.001 | 0.006 | -0.049*** | 0.176*** |
| r_squared | 0 | 0 | 0.01 | 0.03 | 0.4 |
| adjusted_r | 0 | 0 | 0 | 0.03 | 0.4 |
| f-stat | 1.83 | 1.55 | 2.4 | 12.3 | 262.77 |
| n_obs | 1550 | 1550 | 1550 | 1550 | 1550 |